As you can probably tell from my other posts on this site I advocate utilizing as many sources of energy as possible, but I also try to be realistic and consider environmental and economic factors.
So what does it mean to be green?
Part 1
– Potential Cumulative Energy Production
Part 2 and 3?
– Land Usage
– Some Thoughts on EROEI (energy returned on energy invested)
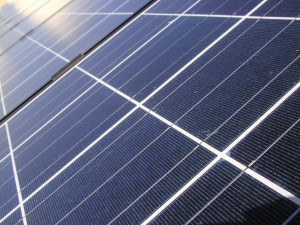
Solar:
In the best case around 260 kWh/ sq ft per year reaches the surface of the earth. (New Mexico)
A large portion of the United States is closer to 211 kWh/ sq ft per year.
The most efficient solar cell that can be purchased in today’s market is about 29% but an average solar cell would convert about 13% the total solar energy it receives to usable power.
Best case .29*260 = 75.4 kWh/ sq ft per year.
What I will call average .13*211 = 27.4 kWh/ sq ft per year. (average based on land not population distribution)
An average US home uses 8,900 kilowatt-hours of electricity each year. (Probably a little high)
Good: 8,900 kWh/y year / 75.4kWh/y = 118.1 sq ft
Average: 8,900 kWh/y year / 27.4kWh/y = 324.8 sq ft
Price per square foot for solar panels ranges between 100 and 300 sq ft installed so $150 seems possible.
Good: $150 * 118.1 sq ft = $17,715
Average: $150 * 324.8 sq ft= $48,720
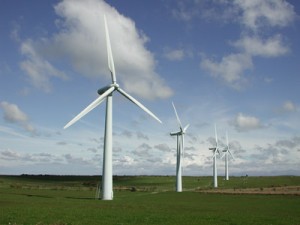
Wind:
Most commercial wind turbines range between 2 and 3 MW, and in 2007 it cost $1.2 million to $2.6 million, per MW of nameplate capacity installed.
We still need to factor in efficiency which on commercial systems can range between 20% and 45% (In ND).
Best Case 3000kWh*.45 = 1350kWh ~3.6 million
Average 3000kWh*.25 = 750kWh ~$4.5 million
Good: Annual power production 1350kWh*24*365 = 11826000 kWh/year
Average: Annual power production 750kWh*24*365 = 6570000 kWh/year
30 year lifespan * 11826000 kWh/year = 354,780,000 kWh/ 30 years
30 year lifespan * 6570000 kWh/year = 197,100,000 kWh/ 30 years
Oil:
There really is no such thing as average when it comes to the cumulative production of an oil well, but most modern oil well in the US will yield somewhere between 200,000 and 2.5 million barrels of oil over their life time. (30-50 years in many cases.) It is also important to note that the payback is front loaded meaning production is very high when a well is brought online and declines over the life of the well. What that really means is that the pay back period is relatively fast.
Barrel of oil equivalent (boe) = approx. 6.1 GJ (5.8 million Btu), equivalent to 1,700 kWh. “Petroleum barrel” is a liquid measure equal to 42 U.S. gallons (35 Imperial gallons or 159 liters); about 7.2 barrels oil are equivalent to one tonne of oil (metric) = 42-45 GJ.
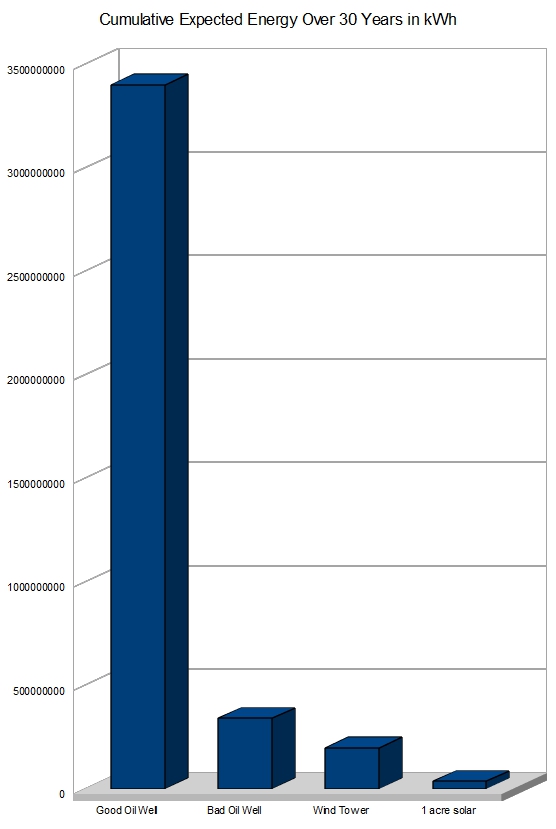
Good well 1700kWh * 2,000,000 barrels = 3,400,000,000 kWh
Bad well 1700kWh * 200,000 barrels = 340,000,000 kWh
The previous calculation got me accused of trying to skew the results, but realistically it is difficult to find efficiency values for how much energy is actually usable from a barrel of oil. The reason I originaly did not factor efficiency on oil is because the energy does exist and is stored in a barrel of oil even if it is not properly used. Efficiency was factored into solar and wind energy because energy is not tangible if it is not created and therefor it is necessary to factor it in.
With the last statement said we all know that energy from oil is used poorly in most cases so it is safe to assume efficiency factors that range between 20 and 60%.
.6 * 3,400,000,000 kWh = 2,040,000,000 kWh
.6 * 340,000,000 kWh = 20,400,000 kWh
.2 * 3,400,000,000 kWh = 680,000,000 kWh
.2 * 340,000,000 kWh = 68,000,000 kWh
Just to make sure solar cells don’t feel left out we will say that oil wells and wind towers have about a one acre footprint 43560 sq ft (more like .25 acre) . Which will cost you… $100(bulk rate) * 43560*= $4,356,000. So now our cost for each energy source is between 4 and 5 million US dollars. This is how it shakes out.
Average: 43560 sq ft* 27.4kWh/y *30 years = 35,806,320 kWh/ 30 years
Good: 43560 sq ft* 75.4kWh/y *30 years = 98,532,720 kWh/ 30 years
The most important detail that is not depicted in this chart is that the payback time for petroleum based power sources is rapid because petroleum production is typically high soon after a well is brought online. Over time petroleum production declines, but the company has already made all of the input cost back and moved on to drill more wells. Solar and wind return energy consistently but slowly which makes it difficult to rapidly grow. Growth in wind production has to be based on some forum of credit and long term planning which isn’t something that makes share holders happy (the same is somewhat true for tax subsidies too). The input cost and energy requirements that go into producing oil is very high and the efficiency is low, but none of that seems to matter as long as the payback period is short.
Sources:
Energy Conversions: http://bioenergy.ornl.gov/papers/misc/energy_conv.html
Solar and Wind estimates: http://www.npr.org/templates/story/story.php?storyId=110997398
Solar Efficiency: http://sroeco.com/solar/most-efficient-solar-panels
Wind power pricing and rating: http://www.windustry.org/how-much-do-wind-turbines-cost
| Oil Well | Oil @ 10% efficency | Wind Tower | 1 acre solar |
| 3400000000 | 340000000 | 197000000 | 35806320 |


I’m curious why you didn’t include coal and natural gas along with oil for comparison. More of our electric power in the US comes from coal and natural gas than oil. I don’t mean to criticize, the point was well made just using oil, but it would be interesting to see the same graph also including coal and gas.
There are advances being made in solar technology, particularly with different semiconductor materials such as CdTe, and thin-film technology which uses less materials and will eventually be a much cheaper alternative to the stanbdard silicon-based panels. And, solar panels use materials which have to me mined, processed, and shipped around the world. And wind turbines create a fair amount of toxic waste during the manufacturing process (as you know), and they also use materials which have to be mined, processed, and shipped before the manufacturing process begins, which itself consumes a large amount of electrical energy.
Nothing is free, and renewables aren’t magical saviors. And while solar and wind power, pound for pound, can’t stand up against fossil fuels, what will drive development and utilization in the future will not be simply economics, it will be necessity. Rising oil costs will drive up the price of every other commodity which depends on it, because the increased costs of extraction and production of food and raw materials will be passed on to the consumers.
The cost of energy derived from oil and coal can only increase in the long term. We will reach a point, in my opinion, where the cost per unit of energy produced by solar/wind will be low enough in comparison to oil and coal to sway the market forces in the other direction. Not to mention the security benefits of updating and diversifying our power grid, reducing emissions from coal plants, etc.
Here’s another interesting chart:
http://www.nrel.gov/analysis/tech_costs.html
If we reach our goal (industry goal, also stated by the White House) of $1 per watt produced by solar panels or films, which is entirely possible, the capital cost and capacity factor would be farther to the left, directly comparable to and even cheaper than most of the other methods listed. Of course the lower capacity factor still has to be considered, which is a reflection of panel efficiency and diurnal variations in electrical generation capacity. But combined with wind, and hopefully geothermal power sources, we could have a power grid that essentially runs itself for a fraction of the long-term costs of a typical coal plant, while reducing our energy-sector emissions of things like mercury and Co2 to practically zero.
Also to be considered in this debate is the state of political affairs, tax benefits and subsidies, the strength of the extractive industry lobbies, and the so-called “scientific” PR firms commissioned by said industries to publish BS data claiming their product to be forever infinitely superior. All of these things, along with market forces and reserves of finite resources, will determine our energy future.
Another downside of solar: Its not maintenance free. Even a slight film of dirt will reduce a panels output significantly. Panels have to be cleaned (not just with water). For homes with roof mounted systems, this just isn’t practical.
I have started to educate myself in regards to the latest nuke plant designs. Toshiba has enough confidence in their ‘nuclear battery’ design that they offered to install one in Galena Alaska with no upfront cost to the community. Toshiba plans to make a good return selling electricity and heat to the community. God only knows when it will get regulatory approval though.
I plan to cover other energy sources. I just didn’t have time find the numbers. I am less familiar with natural gas and coal in terms of energy production and life span.
Hey Ben.. did you see the latest charge against shale drilling? Radioactive waste water!
http://www.philly.com/philly/business/117300118.html?cmpid=15585797
and this one
http://earlywarn.blogspot.com/2011/02/radioactivity-in-shale-gas-drilling.html
I hadn’t seen it until now, but it is likely since shales often concentrate radioactive elements, and produced frack water does mobilize many radioactive elements.
I have a hard time believing that treated frack water would raise the background level of radiation of stream water enough to make it unsafe to drink, but I suppose it is possible. If just the frack water is tested it would surely be unsafe to drink(based on radiation alone), but if you mix it off with billions of gallons in a river it should just look like regular background noise.
I personally live in a river valley with a large flood plain and the clays concentrate radioactive elements just like the shale. I also live near outcrops of the Pier Formation which have slightly radioactive bentonite beds sourcing sediment to the river. Long story short everyone in my area is probably exposed to more radiation every day than people on the East Coast, and for the most part there are no negative health impacts.(although there are a few studies currently going on)
I have a few new fracking posts on http://thebakkenformation.com
Hey Ben! Did you see this? Looks like the EPA is going to try to ban hydraulic fracturing:
http://www.investors.com/NewsAndAnalysis/Article.aspx?id=570654&utm_source=feedburner&utm_medium=feed&utm_campaign=Feed:%20EditorialRss%20%28Editorial%20RSS%29
I hadn’t seen it. I’ve been very busy. Thanks for posting the link. I’m not exactly sure what that is going to do to the energy industry, but it probably isn’t good. My home state is already fighting with the feds over whether or not we can take water out of Lake Sakakawea for fracking. So far I think the answer is no which is ironic because surface runoff far exceeds what could possibly be used for fracking. The loop hole is that they are allowed to use tributary water before it reaches the lake so I have a feeling that is what they might do.
I was curious if you ever thought of changing the page layout of
your blog? Its very well written; I love what youve got to say.
But maybe you could a little more in the way of content
so people could connect with it better. Youve got an awful lot of
text for only having 1 or two images. Maybe you could space
it out better?
Good post. I learn something totally new and challenging on blogs I stumbleupon on a daily basis.
It will always be exciting to read through content from other
writers and use something from other web sites.
My partner and i savour, trigger I stumbled upon what precisely I became looking with regard to. You’ve was over the 4 working day very long search for! The lord Appreciate it male. Have a good day time. Bye
Your graph compares a good oil well with ONE wind turbine. The proper comparison would be between an oil well an a wind FARM. The scale and cost of one turbine is minuscule compared with an oil production platform (let’s face it, the important reserves are further offshore now and that is a very expensive place to set up).
Please compare an oil well with a whole wind farm and then the power of wind will be revealed.
I’m afraid you are ill informed on the cost of an utility sized turbine. They are 2-4 million installed. Oil wells in the Bakken are about 8 Million so one oil well is about equal to the cost of two wind turbines. It should also be noted that oil wells in the Bakken are very complex and involve drilling two miles down then two additional miles laterally. By comparison many wells around the country would be way cheaper than building a grid scale wind tower. A simple vertical well could be finished in a mater of days.
http://www.windustry.org/resources/how-much-do-wind-turbines-cost
I would say your information regarding reserves is about 7 years out of date. Seven years ago I would have agreed with you.
I’m unsure of the reduction in cost of wind towers since I last posted, but I can confidently say that it now costs under 4 million for a Bakken Well.
Total drill time start to finish is consistently under 14 days (Usually around 10.5-12). The cost to drill a Bakken Well is approaching 1/4 what it cost in 2013.
What Changed?
* Drill bit technology is much better
* Down hole tool reliability is better and the data is better
* Pumping systems are better Helps^
* Oil Companies are drilling in areas they are familiar with. (shallow learning curve)
* The slow rigs are currently stacked because of low prices
* The staff is mostly composed of veterans due to low oil prices
* More jobs have gone remote so one guy is doing the job of two or more people.
…. The other good news here is that the price of solar has been falling like a rock so it should soon be able to compete directly. (I’m actually thinking that is partly why the OPEC countries pushed up production) It’s time to get it out of the ground before it loses any more value.